SG-Flag Malaysia-Flag

Uniplot

About Uniplot

Visualize and Analyze 2D and 3D Data with UniPlot for Windows

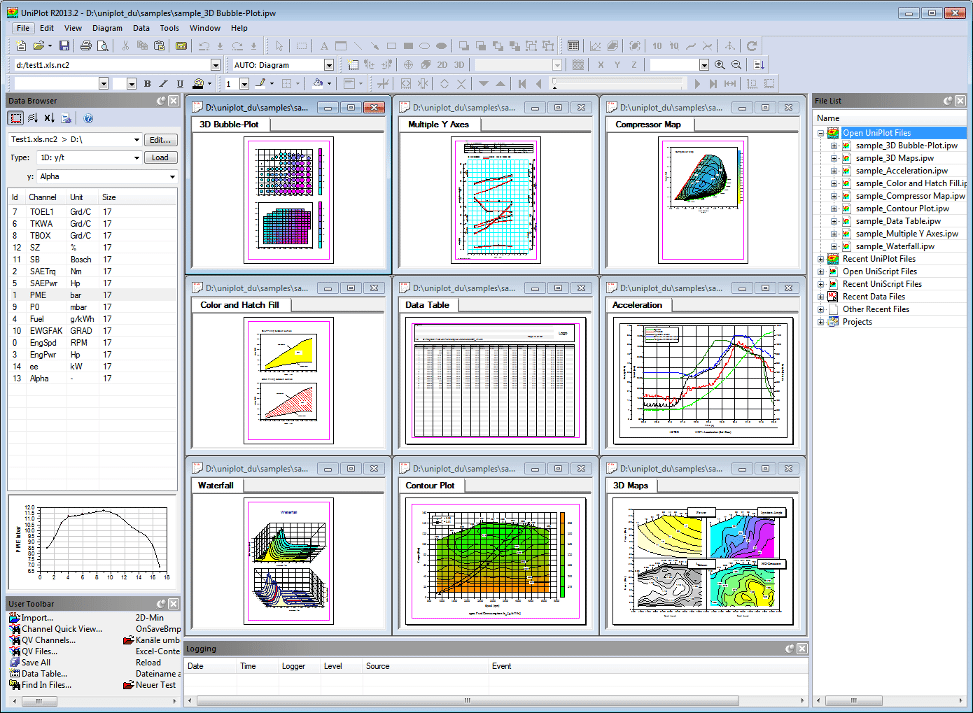
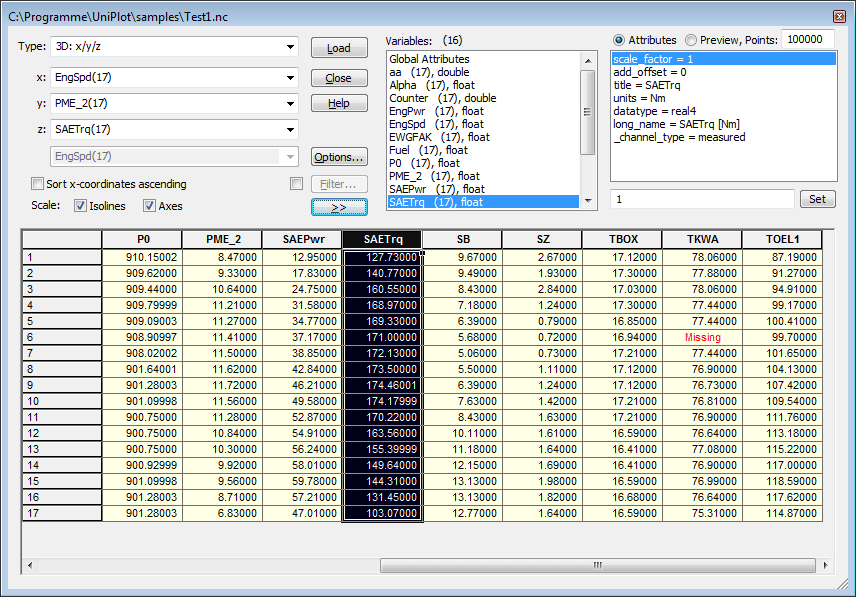
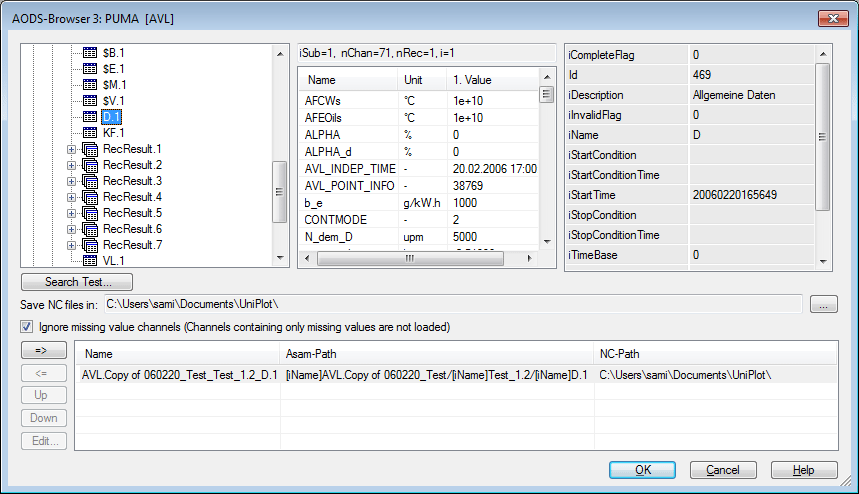
UniPlot was developed to visualize and analyze test data. With only a few mouse clicks, you can transform your data into 3D surface maps with color zones, contour maps with color fill, or plot 2D data into diagrams with several axes. Text objects, scanned photos and other drawing and labeling elements can be easily inserted into the document. Data can be processed interactively or automated for repetitive tasks or analysis.

UniPlot offers an efficient and powerful programming language. It enables the user to add new functions to the user interface, to execute complex mathematical data analysis, to import specially formatted data files or to automatically produce complete documentations.

Uniplot Features

General

  • Graphic documents with up to 255 pages
  • Help system in English and German
  • Diagrams, datasets, drawing objects can be edited with the mouse
  • Context menus
  • Multi-level Undo/Redo
  • Export as PDF, EPS, JPG, PNG, TIFF, GIF, BMP, BMZ, EMF, EMZ, WMF, WMZ.
  • Send to Word, Send to PowerPoint
  • Full screen mode
  • Fast document loading
  • Free UniPlot document viewer
  • Unicode

Diagrams

  • Any number of diagrams on one page and any number of datasets in one diagram.
  • Diagrams with one or more x- and y-axis.
  • Diagram size and position can be specified in centimeters with true scaling, e.g. 1 centimeter equals 20Nm.
  • Axes can be scaled ascending and descending.
  • Extensive settings for gridlines, tick marks and axis titles and labels.
  • Automaticallly or manually scaled axes.
  • Date/Time axes scaling.
  • Log axes scaling.
  • Square axes scaling.
  • Use text for tick labels.
  • Polar diagram.
  • Waterfall diagram.

2D Line Plots

  • Mark data points with symbols and droplines.
  • Connect points with straight or curved lines (spline, smoothing, regression or nonlinear curve fitting).
  • Dash-Dotted lines with adjustable line thicknesses and user defined patterns.
  • Color and hatch filling underneath a curve.
  • Area between curves can be color and hatch filled.
  • Ajustable hatchline distance, line thickness and color.
  • Horizontal oder vertical bargraphs.
  • Automatic creation of editable legends.
  • Upper and lower hull curve.
  • Data smoothing to reduce signal noise.
  • Linear or logarithmic axis scaling.
  • Datapoints can be labeled.
  • Data Cursor.

Contour Maps

  • Automatic or manual distribution of isolines (z-levels).
  • Insertion or deletion of isolines and labels with one mouseclick.
  • Set line style (type, width, color) for one or more isolines or for a range of isolines.
  • Color fill between isolines.
  • Color scale bar.
  • Adjustment of isoline labels to the isoline gradient. They can be plotted with a frame and in the same color as the isolines.
  • Calculation of isoline areas.
  • Cross section of contour maps for x=const, y=const or along any curve.
  • WOT curves can be used as a data hull. Points of the WOT curve can be labeled.
  • The contour map data hull can be freely defined. The hull can contain islands.
  • Splines for isolines and WOT curve.
  • Any number of 2D and 3D datasets can be plotted in one x/y diagram (i.e. power and consumption maps).
  • The data can be drawn as a scatter plot. Extreme values (minimum and maximum) can be marked.
  • Linear, non-linear and Thin Plate Spline gridding methods and data smoothing.

3D Surface Maps

  • Mesh plots with or without hidden line removal.
  • Surface mesh can be clipped at the data hull, set to “0” outside the hull or extrapolated to the edge of the diagram.
  • 3D surface grid lines correspond to the axis division marks.
  • Draw isolines on surface.
  • Orthographic or perspective projection.
  • Bilinear or spline interpolation to change the number of columns and rows of matrices.

Drawing Objects

  • Draw lines, arrows, rectangles and ellipses.
  • Multi-line text objects with centered, right or left justification.
  • Grouping drawing objects to a single unit.
  • Send to back, send to front, drag and resize, copy, cut, alignment drawing objects.
  • Adjustable element attributes: color fill (solid or gradient), shadow, size, position, round edges etc.
  • Adjustable snap to grid for easy mouse editing.
  • Protect objects from accidental mouse changes.
  • Insert pictures (JPG, BMP, GIF, PNG, BMZ, EMF, EMZ, WMF, WMZ).
  • OLE server and container. Insert UniPlot diagrams into other Windows applications or insert graphics, tables, text etc. into UniPlot documents.
  • If LaTeX is installed it can be used to insert formula text.

Data Handling

  • Fast data browser. Up to 10000 channels. Rows only limited by file size of 2 GB.
  • Channels can have different data types (4 and 8 byte float, 8-, 16- and 32-Bit integer, date/time. Strings).
  • “Missing-Values”.
  • Filter, sort channels.
  • Add, Transform channels using the formula interpreter.
  • Insert/delete/edit of gloabel attributes or channel attributes.
  • Delete channels or rows.
  • Freeze columns.
  • Create Excel Reports.
  • The Browser can be extended by user defined functions.
  • Import ASCII- or Microsoft-Excel (incl. Excel 2007), VS100/INCA-, dBase-, Lotus-, FEVIS-, Combi-, IFILE-, netCDF-, MATLAB and other Data formats. New filters can be added using the build in language UniScript Data base access e.g. via ADO or DAO.
  • Import time signals (1D data).
  • Import x/y data curves (2D data).
  • Import irregularly distributed 3D data.
  • Import equidistantly distributed matrix data.
  • Import non-equidistantly distributed matrix data.
  • Import hull data.
  • Export interpolated matrix data.
  • Export hull data.
  • ASAM-ODS database (RPC and Corba).

UniScript Programming Language

  • UniScript is a matrix orientated interpreter with a C-like syntax.
  • Add new functions to UniPlot.
  • Automate repetitive tasks.
  • Analyse and transform data.
  • Functions to alter menus and to create dialog boxes. Dialog boxes can contain text, edit fields, list boxes, combo boxes and check boxes.
  • Trigonometric, sort, search, read and write (ASCII, Excel, binary) functions.
  • Linear algebra (inverse, eigenvalues, determinants etc. – these functions build on BLAS/LAPACK/LINPACK routines).
  • FFT and iFFT.
  • Systems of ordinary differential equations.
  • Fitting splines.
  • Non-linear regression.
  • Complex numbers: most of the operators and mathematical functions can be applied for complex numbers.
  • Strings: string vectors and matrices, concatenate, compare, search and replace, sort.
  • Flow control: for, while, break, continue, return, if-then-else, try-except.
  • UniPlot has some thousand functions. New functions can be defined by user.
  • DLL’s (dynamic linking) written in C, C++ or other languages can be loaded to UniPlot.
  • UniScript has access to all documents, data sets, diagrams, drawing objects, menus, editors belonging to UniPlot.
  • UniPlot is an ActiveX Server and ActiveX Client.
  • UniPlot is an OLE Server.
  • Source code debugger.
  • Editor with syntax highlighting.
  • UniScript can be used as a stand alone program

System Requirements

  • Windows XP, Windows Vista, Windows 7, Windows 8/8.1, Windows 10.

For Any Products Or Services Enquiry.

We will get back to you soonest.

Quick Quote

Our Partners

  • bluebeam-logo